Unlocking Sales Superpowers: Metrics That Matter
In today's competitive market, sales efficiency is crucial for success. This listicle reveals seven key sales efficiency metrics to provide a complete picture of your sales performance. We'll cover everything from initial contact to closed deals, offering actionable strategies to improve each metric. By mastering these metrics, you can unlock your team's potential and drive revenue growth.
This in-depth guide helps early-stage startups scale revenue, SMBs reduce sales hiring costs, and enterprise companies optimize their remote sales expertise. HR and talent acquisition professionals will also gain valuable insights into global hiring best practices. Sales leaders can use this information to build and manage top-tier sales teams.
Understanding sales efficiency metrics empowers you to:
- Identify bottlenecks: Pinpoint areas slowing down your sales process.
- Optimize performance: Implement data-driven strategies for improvement.
- Boost revenue: Increase sales by focusing on the most impactful activities.
- Reduce costs: Streamline processes and allocate resources effectively.
We'll explore the following critical sales efficiency metrics:
- Sales Velocity
- Lead Response Time
- Sales Cycle Length
- Win Rate (Close Rate)
- Customer Acquisition Cost (CAC)
- Activities per Opportunity
- Pipeline Velocity
Let's dive into the metrics that drive sales success.
1. Sales Velocity
Sales velocity measures how quickly prospects move through your sales pipeline and convert into paying customers. It provides a holistic view of sales efficiency, combining crucial factors like deal volume, value, win rate, and sales cycle length into a single, powerful metric. This makes it a critical KPI for businesses seeking to optimize their sales processes and accelerate revenue growth. By understanding sales velocity, you can identify bottlenecks, improve forecasting accuracy, and ultimately boost your bottom line.
Calculating and Applying Sales Velocity
Sales velocity is calculated with the following formula: (Number of Opportunities * Average Deal Size * Win Rate) / Sales Cycle Length. This metric provides a comprehensive snapshot of your sales performance. For instance, a higher sales velocity indicates a faster rate of revenue generation, while a lower velocity suggests potential inefficiencies in your sales process. Tracking sales velocity allows you to pinpoint areas for improvement and make data-driven decisions.
Real-World Examples of Sales Velocity in Action
Leading companies leverage sales velocity to optimize their sales strategies. HubSpot, for example, uses sales velocity to fine-tune its inbound sales process. Salesforce tracks velocity across different product lines for strategic resource allocation. SaaS companies, in particular, find sales velocity invaluable for measuring the effectiveness of sales process improvements. By analyzing sales velocity data, these businesses gain actionable insights to drive continuous improvement and achieve sustainable growth.
The infographic below provides a quick reference for the core components of sales velocity.
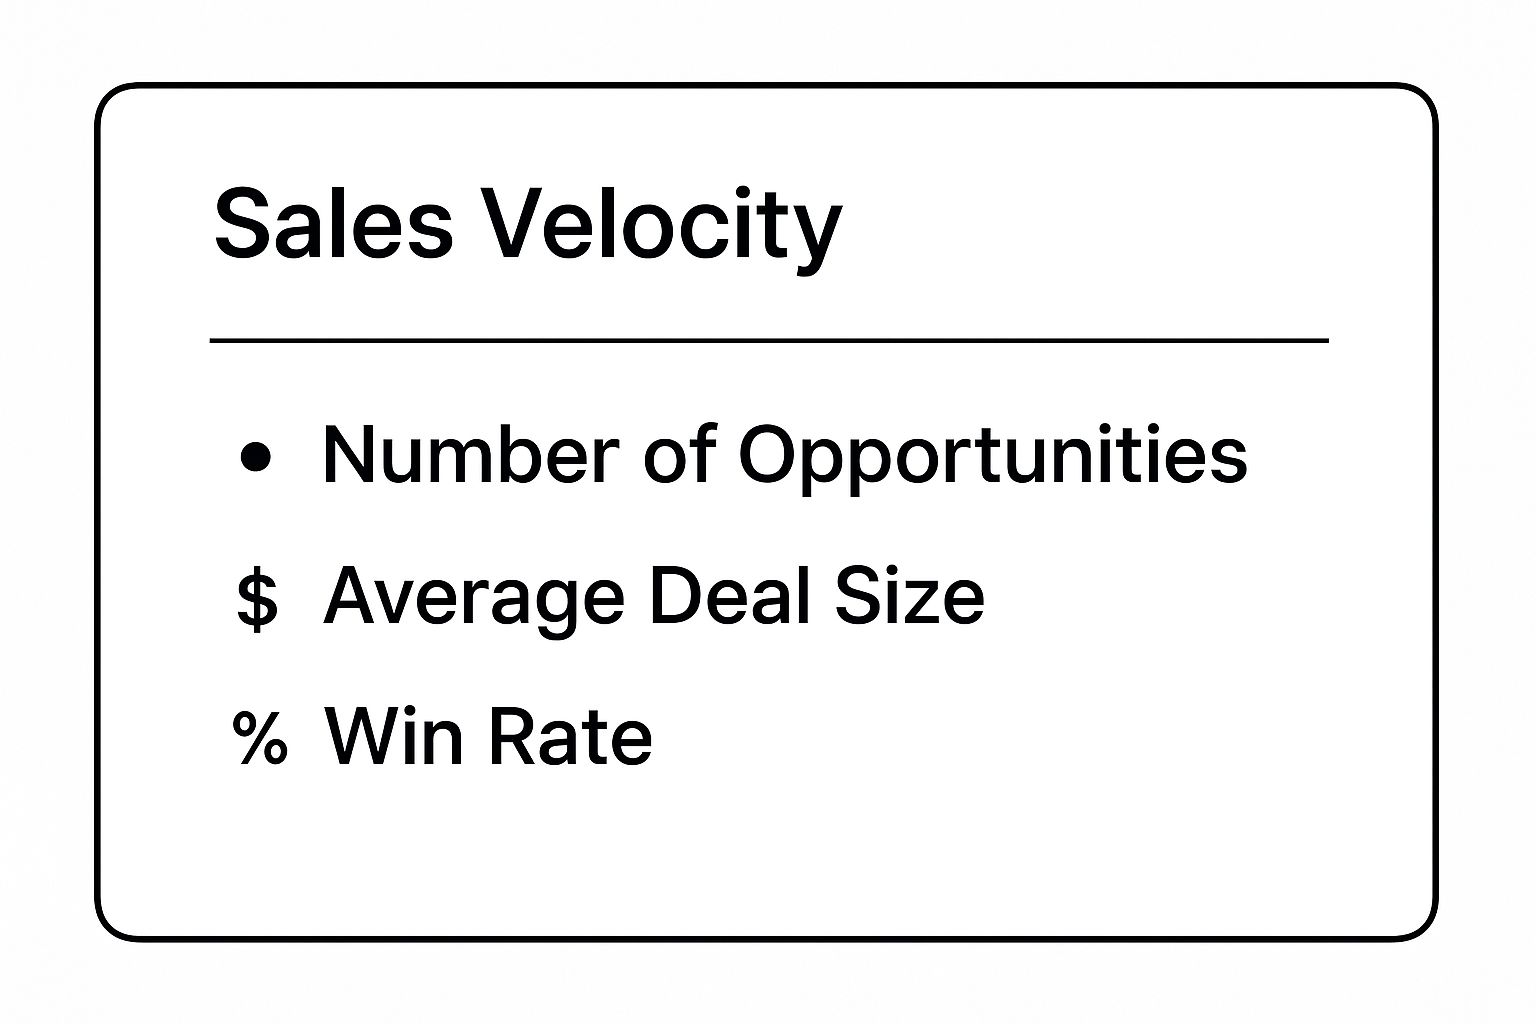
This visual summary highlights the interplay of opportunity count, average deal size, and win rate – all crucial factors influencing the overall sales velocity. By monitoring and optimizing these individual metrics, you can significantly impact your overall sales performance.
Actionable Tips for Improving Sales Velocity
- Track Velocity by Segment: Analyze sales velocity by sales rep, team, product line, and customer segment to identify specific areas for improvement and tailor your strategies accordingly.
- Prioritize Weakest Components: Focus on improving the weakest component of the sales velocity formula first. Is your win rate low? Are your deal sizes too small? Addressing these bottlenecks will yield the greatest impact.
- Focus on Trends: Use velocity trends over time rather than absolute numbers for more effective decision-making. This provides a clearer picture of progress and identifies potential issues early on.
- Data Integrity is Key: Ensure your CRM data is clean, accurate, and standardized for reliable sales velocity calculations. Inaccurate data leads to flawed insights and ineffective strategies.
By implementing these tips and consistently monitoring sales velocity, businesses can gain a competitive edge, optimize their sales processes, and achieve sustainable revenue growth. This metric offers valuable insights into the health and efficiency of your sales operations, making it a crucial tool for any organization striving to maximize its sales performance.
2. Lead Response Time
Lead response time measures how quickly your sales team responds to new leads or inquiries. This metric tracks the elapsed time between lead generation (e.g., website forms, phone calls, referrals) and the first contact by a salesperson. Minimizing this time is crucial because research consistently shows a strong correlation between faster response times and higher conversion rates. A prompt response demonstrates responsiveness and professionalism, significantly increasing the likelihood of engaging a potential customer and gaining a competitive edge.

Calculating and Applying Lead Response Time
While seemingly straightforward, accurately calculating lead response time requires consistent tracking mechanisms across all lead sources. This might involve integrating your CRM with lead capture tools, implementing lead routing software, or even using manual logs for smaller operations. Once tracked, analyze response times by lead source, sales representative, and time of day to pinpoint areas for improvement. Understanding these nuances allows you to optimize your sales process and prioritize high-value leads effectively.
Real-World Examples of Lead Response Time in Action
Companies across various industries have seen dramatic improvements by prioritizing lead response time. InsideSales.com's research revealed a staggering 50x increase in conversion rates when responding within 5 minutes. Marketo, a marketing automation platform, uses automated lead routing to achieve sub-5-minute response times, significantly improving their sales efficiency. Even in traditional sectors like real estate, instant text responses are now common practice for capturing hot leads and scheduling immediate viewings.
Actionable Tips for Improving Lead Response Time
- Set Up Automated Lead Routing and Notifications: Automate the process of assigning leads to the appropriate sales representative and instantly notifying them of a new lead. This ensures prompt attention and reduces the risk of leads falling through the cracks.
- Use Chatbots for Immediate Initial Response: Implement chatbots on your website to provide instant answers to common questions and qualify leads before handing them off to a sales representative. This provides immediate engagement and frees up sales teams to focus on qualified leads.
- Track Response Time by Lead Source: Analyze response times by different lead sources (e.g., website forms, social media, email) to identify patterns and optimize your strategies accordingly. Some sources might require faster responses than others.
- Balance Speed with Quality of First Interaction: While speed is crucial, don't sacrifice the quality of your first interaction. Ensure your initial response is personalized, relevant, and adds value to the prospect's experience.
By implementing these tips and diligently tracking lead response time as a key sales efficiency metric, businesses can significantly improve their conversion rates, enhance customer experience, and gain a competitive edge in today's fast-paced market.
3. Sales Cycle Length
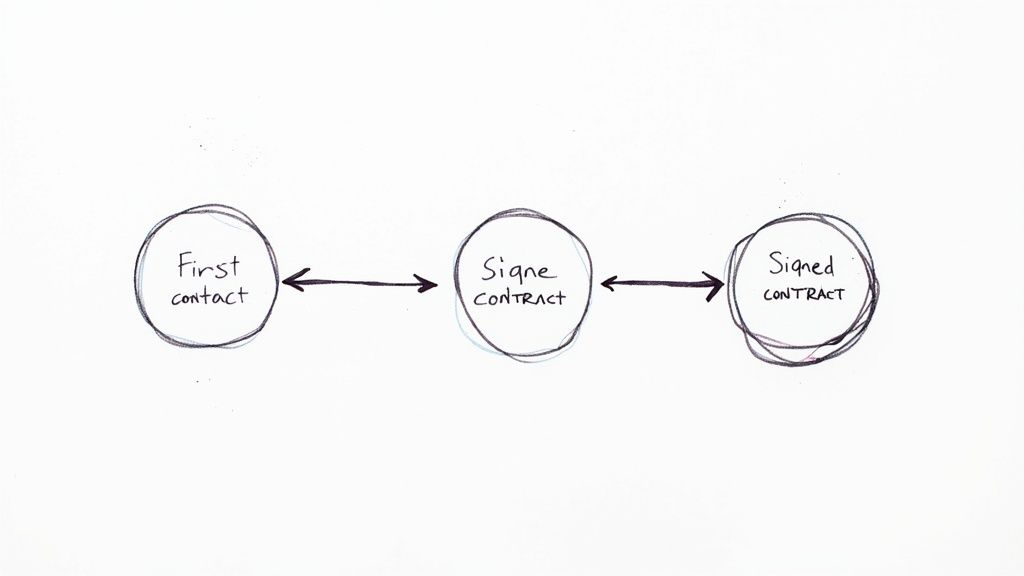
Sales cycle length measures the average time it takes to close a deal, from the initial contact with a prospect to the final signed contract. This critical sales efficiency metric provides valuable insights into your sales process effectiveness, forecasting accuracy, and overall revenue generation potential. Understanding your sales cycle length is paramount for identifying bottlenecks, optimizing sales strategies, and ultimately, driving revenue growth. By analyzing this metric, you can pinpoint areas for improvement and accelerate deal closures.
Calculating and Applying Sales Cycle Length
Calculating sales cycle length involves determining the average time elapsed for all closed-won deals within a specific period. This is typically done by summing the time taken for each closed-won deal and dividing by the total number of closed-won deals. This provides a clear benchmark for your sales process efficiency. A shorter cycle length generally indicates a more streamlined and efficient sales process, while a longer cycle length may suggest areas for improvement.
Real-World Examples of Sales Cycle Length in Action
Companies across various industries actively leverage sales cycle length optimization to boost revenue. Oracle, for instance, significantly reduced its enterprise software sales cycle from 18 months to 9 months through strategic process optimization. Zoom, with its freemium model, effectively shortened B2B sales cycles by allowing potential clients to experience the product firsthand. Manufacturing companies often track sales cycle length separately for new versus existing customers to tailor their sales approach and optimize customer acquisition and retention strategies.
Actionable Tips for Improving Sales Cycle Length
- Segment by Deal Size and Complexity: Analyze cycle length by deal size, product complexity, and customer segment to identify specific areas for improvement and target your efforts effectively.
- Identify Bottlenecks: Carefully examine each stage of your sales process to pinpoint where deals tend to stall. This analysis can reveal critical bottlenecks that hinder deal progression.
- Leverage Sales Enablement Tools: Implement sales enablement tools to empower your sales team with the resources and information they need to accelerate key stages of the sales process.
- Track Both Average and Median: Monitoring both the average and median cycle length offers a more comprehensive view of your sales performance. This approach helps to identify outliers and provides a more accurate assessment of typical deal progression.
By consistently tracking and analyzing sales cycle length, businesses gain valuable insights into sales efficiency. This metric, combined with other sales efficiency metrics, allows organizations to make data-driven decisions, optimize sales processes, and achieve sustainable revenue growth. A shorter sales cycle contributes significantly to faster revenue generation and improved overall business performance.
4. Win Rate (Close Rate)
Win rate, also known as close rate, measures the percentage of qualified sales opportunities that convert into closed-won deals. This fundamental sales efficiency metric provides crucial insights into how effectively your sales team converts prospects into paying customers. Analyzing win rate helps you understand sales effectiveness, competitive positioning, and the overall quality of your sales process. It can be calculated at different stages of the sales funnel, offering a granular view of performance. A strong win rate is a key indicator of a healthy sales pipeline and efficient sales operations.
Calculating and Applying Win Rate
Calculating win rate is straightforward: (Number of Closed-Won Opportunities / Total Number of Qualified Opportunities) * 100. This metric provides a clear picture of your sales team's ability to close deals. For instance, a high win rate suggests a strong sales process and effective closing techniques, while a low win rate may indicate areas for improvement in lead qualification, needs analysis, or proposal development. Regularly tracking win rate helps identify trends and pinpoint areas needing attention. Learn more about win rate and its application in evaluating sales performance at AboutHire.
Real-World Examples of Win Rate in Action
Understanding industry benchmarks for win rates is essential for context. IBM's enterprise sales teams, dealing with complex, high-value deals, often maintain win rates between 25-30% in highly competitive environments. Inside sales teams, typically handling a higher volume of smaller deals, often see win rates in the 15-20% range. Channel partners, leveraging their unique relationships and market access, frequently experience different win rates compared to direct sales teams. These examples illustrate how win rate varies across different sales models and industries.
Actionable Tips for Improving Win Rate
- Track Win Rates by Segment: Analyze win rates by sales stage, individual sales representative, deal type, product line, and customer segment. This granular approach helps pinpoint specific areas for improvement. Identify top performers and analyze their strategies to replicate success across the team.
- Analyze Lost Deals: Conduct thorough post-mortem analyses of lost deals to uncover patterns and identify recurring reasons for losses. This valuable information can reveal weaknesses in your sales process, product positioning, or competitive strategy.
- Consistent Qualification: Implement and enforce consistent opportunity qualification criteria. Focusing on highly qualified leads increases the likelihood of closing deals and improves overall win rate. This ensures that sales efforts are directed towards prospects with the highest potential for conversion.
- Benchmarking: Regularly compare your win rates against industry benchmarks and competitors. This helps identify areas where you excel and where you need to catch up, enabling you to prioritize improvement initiatives.
By consistently monitoring and actively working to improve win rate, businesses can optimize their sales processes, increase revenue, and gain a competitive edge in the marketplace. This crucial sales efficiency metric offers valuable insights into the effectiveness of your sales strategies and identifies opportunities for continuous improvement.
5. Customer Acquisition Cost (CAC)
Customer Acquisition Cost (CAC) represents the total cost of acquiring a new customer. This includes all marketing and sales expenses, from advertising campaigns and content creation to sales team salaries and software subscriptions. Calculating CAC involves dividing the total acquisition costs by the number of new customers acquired within a specific period. Understanding CAC is crucial for assessing the efficiency of your sales and marketing investments and informing sustainable growth strategies. By optimizing CAC, businesses can maximize their return on investment and achieve profitable growth.
Calculating and Applying Customer Acquisition Cost
The basic formula for calculating CAC is: Total Acquisition Costs / Number of New Customers Acquired. However, accurately calculating CAC requires meticulous tracking of all relevant expenses. This includes direct costs like advertising spend and sales salaries, as well as indirect costs such as marketing software subscriptions and overhead allocated to sales and marketing activities. Accurately calculating CAC provides valuable insights into the profitability of your customer acquisition efforts. For example, a high CAC relative to customer lifetime value (LTV) signals potential issues with your sales and marketing efficiency.
Real-World Examples of Customer Acquisition Cost in Action
Successful companies prioritize optimizing their CAC. Dropbox famously achieved a CAC of $233 against a customer lifetime value (LTV) of $388, largely through its highly effective referral program. HubSpot, a leader in inbound marketing, meticulously tracks CAC across various channels, allowing them to optimize spending and maximize ROI. E-commerce companies commonly track CAC by segmenting it by paid search, social media, and email marketing, enabling them to identify the most cost-effective acquisition channels. These examples demonstrate the power of strategically managing CAC to drive sustainable growth.
Actionable Tips for Improving Customer Acquisition Cost
- Include All Relevant Costs: Ensure your CAC calculations encompass all direct and indirect expenses associated with acquiring new customers. This includes salaries, tools, advertising, and overhead.
- Track Trends Over Time: Focus on analyzing CAC trends over time, rather than just focusing on absolute numbers. This helps identify emerging patterns and potential issues early on.
- Segment CAC: Break down CAC by customer type, acquisition channel, and product line. This provides granular insights into the effectiveness of different strategies and allows for targeted optimization.
- Compare CAC to LTV: Ensure your CAC is significantly lower than your Customer Lifetime Value (LTV). A healthy LTV:CAC ratio is essential for long-term profitability.
By diligently tracking and optimizing CAC, businesses can gain a deeper understanding of their sales and marketing effectiveness. This metric empowers organizations to make data-driven decisions, allocate resources strategically, and achieve sustainable, profitable growth. Understanding and managing CAC is crucial for any business seeking to maximize its return on investment in customer acquisition.
6. Activities per Opportunity
Activities per opportunity measures the average number of sales activities (calls, emails, meetings, demos) required to move an opportunity through the sales pipeline or to closure. This metric helps sales managers understand the effort required for different types of deals and identify efficiency opportunities in the sales process. By analyzing this metric, businesses can optimize their sales strategies, improve resource allocation, and ultimately boost their sales efficiency metrics. Tracking activities per opportunity provides valuable insights into the effectiveness of your sales team's efforts and reveals potential areas for improvement.

Calculating and Applying Activities per Opportunity
Calculating this metric is straightforward: divide the total number of sales activities by the total number of opportunities. For example, if your team completed 1,000 sales activities and had 200 opportunities, your activities per opportunity would be 5. This indicates that, on average, it took five activities to work each opportunity. This metric can be further analyzed by segmenting activities by type (email, call, demo, etc.) and by stage in the sales pipeline.
Real-World Examples of Activities per Opportunity in Action
Research from InsideSales.com suggests that 8-12 contact attempts are needed to connect with a B2B prospect. However, the required activity level varies widely depending on deal complexity and sales cycle length. Enterprise software sales, for example, might require 20+ activities per opportunity due to the lengthy decision-making process and multiple stakeholders involved. In contrast, transactional sales might close with only 2-5 activities. Understanding these benchmarks and tracking your own performance helps identify areas for improvement. Learn more about Activities per Opportunity as it relates to sales development representatives.
Actionable Tips for Improving Activities per Opportunity
- Track Activities by Type and Effectiveness: Monitor not just the number of activities, but also their type and conversion rates. Focus on the activities that correlate most strongly with winning deals.
- Focus on Activities that Correlate with Wins: Analyze which activities have the highest impact on moving deals forward and prioritize those activities. This allows your team to focus on high-value actions that drive results.
- Use Activity Data for Sales Coaching: Leverage activity data to identify areas where sales reps need coaching or additional training. This personalized approach helps improve individual performance and overall team effectiveness.
- Balance Activity Quantity with Quality Metrics: While a high activity count can be positive, ensure that the quality of interactions remains high. Focus on meaningful engagement and value creation for prospects.
By monitoring and optimizing activities per opportunity, businesses can fine-tune their sales strategies, improve resource allocation, and achieve higher conversion rates. This metric provides valuable insights into the effectiveness of sales efforts and helps drive continuous improvement in the sales process.
7. Pipeline Velocity
Pipeline velocity measures how quickly opportunities move through specific stages of your sales pipeline. Unlike overall sales velocity, which provides a broader view, this metric focuses on the speed of progression between individual stages. This granular perspective helps identify bottlenecks, optimize the sales process, and ultimately accelerate revenue generation. By understanding pipeline velocity, you can pinpoint areas of friction and implement targeted improvements for a more efficient sales cycle. Want to build a stronger sales pipeline? Learn more about building a sales pipeline: Learn more about building a sales pipeline.
Calculating and Applying Pipeline Velocity
Pipeline velocity is calculated by measuring the average time deals spend in each pipeline stage. This involves tracking the date a deal enters a stage and the date it exits, then calculating the average duration for all deals within that stage. This provides valuable insights into the efficiency of each stage and highlights potential areas for improvement. For example, a long duration in the "proposal" stage might indicate a need to streamline your proposal process or improve communication with prospects.
Real-World Examples of Pipeline Velocity in Action
Across diverse industries, businesses leverage pipeline velocity to optimize their sales processes. SaaS companies, for instance, track velocity from demo to trial to paid conversion, identifying potential friction points in user onboarding. Manufacturing firms measure proposal-to-approval velocity, streamlining communication and internal processes to accelerate deal closures. Similarly, professional services firms track velocity from RFP to contract signing, optimizing their response times and proposal customization to win more deals. These examples illustrate the versatility and applicability of pipeline velocity across different business models.
Actionable Tips for Improving Pipeline Velocity
-
Define Clear Stage Entry and Exit Criteria: Establish clear criteria for when a deal moves from one stage to the next. This ensures consistent tracking and accurate velocity calculations. Ambiguity in stage transitions can lead to inaccurate data and flawed insights.
-
Track Velocity Trends Rather Than Absolute Numbers: Analyze trends in pipeline velocity over time to identify patterns and areas for improvement. This provides a more meaningful understanding of progress than focusing solely on absolute numbers. Trends can reveal subtle shifts in sales performance and highlight areas requiring attention.
-
Identify Stages with Highest Stall Rates: Pinpoint the stages with the longest average duration, indicating potential bottlenecks. Focus your optimization efforts on these stages to achieve the greatest impact on overall pipeline velocity. Addressing these bottlenecks can significantly accelerate deal flow.
-
Use Velocity Data to Coach Sales Reps on Process Improvement: Leverage pipeline velocity data to coach sales reps on improving their individual performance and adhering to best practices. This data-driven approach promotes accountability and continuous improvement within the sales team.
By implementing these tips and consistently monitoring pipeline velocity, businesses can fine-tune their sales processes, accelerate deal flow, and drive sustainable revenue growth. This metric provides valuable insights into the health and efficiency of each stage in the sales pipeline, empowering organizations to identify bottlenecks, optimize their strategies, and maximize their sales performance. This makes pipeline velocity a crucial sales efficiency metric, particularly valuable for companies focused on optimizing their sales process and achieving predictable revenue growth.
Sales Efficiency Metrics Comparison
| Metric | Implementation Complexity 🔄 | Resource Requirements 💡 | Expected Outcomes 📊 | Ideal Use Cases 💡 | Key Advantages ⭐⚡ |
|---|---|---|---|---|---|
| Sales Velocity | Medium to High (complex formula) | Requires clean, consistent data | Improved forecasting, sales efficiency | Revenue predictions, bottleneck identification | Holistic sales view, prioritizes improvements ⭐ |
| Lead Response Time | Low (simple tracking) | Automated routing tools recommended | Faster conversions, competitive advantage | Lead qualification, quick initial contact | Strong impact on conversion, easy to measure ⚡ |
| Sales Cycle Length | Medium (time tracking + segmentation) | CRM data, sales stage tracking | Better forecasting, process bottleneck ID | Resource planning, deal acceleration | Clear sales efficiency indicator, easy benchmarking ⭐ |
| Win Rate (Close Rate) | Low (percentage calculation) | Standard CRM data | Measure of sales effectiveness | Sales team performance, quota setting | Simple, clear measure of success ⭐ |
| Customer Acquisition Cost (CAC) | Medium (cost aggregation) | Sales + marketing expense tracking | ROI analysis, spend optimization | Budgeting, growth strategy | ROI clarity, channel comparison ⭐ |
| Activities per Opportunity | Medium (activity logging + analysis) | Activity tracking tools | Sales effort optimization, coaching insights | Resource allocation, efficiency improvements | Identifies high-effort activities, supports coaching ⭐ |
| Pipeline Velocity | Medium (stage-level tracking) | Well-defined stages, data accuracy | Bottleneck detection, forecast improvements | Process optimization, deal prioritization | Pinpoints stage inefficiencies, targeted improvements ⭐ |
Elevate Your Sales Game with AboutHire
This article explored seven key sales efficiency metrics: Sales Velocity, Lead Response Time, Sales Cycle Length, Win Rate, Customer Acquisition Cost, Activities per Opportunity, and Pipeline Velocity. Mastering these metrics provides crucial insights into your sales process, enabling data-driven decisions that optimize performance and fuel sustainable growth. By understanding how to calculate and interpret these metrics, you can identify bottlenecks, refine strategies, and ultimately boost your bottom line.
The Power of Optimized Metrics
Optimizing your sales efficiency metrics isn't just about improving numbers; it's about building a more effective and profitable sales organization. Reduced sales cycles translate to faster revenue generation. Improved win rates maximize the return on your sales and marketing efforts. Lower customer acquisition costs contribute directly to profitability. By focusing on these metrics, you create a virtuous cycle of continuous improvement.
Actionable Insights for Sustainable Growth
The actionable strategies discussed throughout this article provide a roadmap for enhancing each metric. From implementing sales automation tools to refine lead response time to rigorously tracking sales activities to understand pipeline velocity, these tactics offer practical steps for immediate improvement. Remember, consistent monitoring and analysis are crucial for long-term success. Regularly reviewing these metrics allows you to adapt to changing market dynamics and maintain a competitive edge.
Building a High-Performance Sales Team
Implementing these strategies and consistently tracking progress requires a dedicated and skilled sales team. This is where AboutHire comes into play. A high-performing sales team can leverage these metrics effectively, turning insights into action. They are equipped to adapt strategies, implement changes, and consistently strive for improved performance.
Unlock Your Sales Potential
Ultimately, optimizing sales efficiency metrics is about maximizing your sales potential. It's about empowering your team to achieve greater results with the resources available. It's about building a predictable and scalable sales engine that drives sustainable revenue growth. By embracing these metrics and implementing the suggested strategies, you position your business for long-term success in today's competitive landscape. Ready to build a high-performing remote sales team that can leverage these metrics and drive revenue growth? Visit AboutHire to discover how we can connect you with top-tier sales talent from Latin America and Europe, providing a cost-effective solution for achieving your sales objectives.